As it stands today, my election forecast gives Kamala Harris a 59.13% chance of an electoral college victory, meanwhile Trump maintains a 40.44% of victory. Instead of going through the current polling averages and their changes though, today I want to examine the most likely outcomes that are appearing in the simulation. There is a near certainty that these outcomes and their likelihood change as we get closer to election day. As long as the probabilities of the forecast change, the outcomes will change along with it. Perhaps I will publish another one of these articles closer to election day to see how things have changed. I also want to publish a few of the more unusual possibilities that occasionally pop up in the simulation.
With that being said, let’s walk through the 5 most likely outcomes according to the simulation today. I’ll use 270towin.com to create the maps. Pay no attention to the shade of color, these maps are not meant to predict how close the states will be but simply the winner.
Most Likely Scenario: Trump wins 312 electoral votes
The most likely scenario according to the model is one where Trump sweeps all 7 battleground states and wins 312 votes. This occurs in 10% of all simulations. The map would look like this:
Second Most Likely: Harris wins 319 electoral votes
Likewise, the second most likely scenario would see Harris sweeping all 7 swing states, netting 319 electoral votes in her case. This occurs in 9.5% of all simulations.
Third Most Likely: Harris wins 308 electoral votes
The third most likely outcome sees Harris winning the electoral college with 308 electoral votes. In this scenario she would win 6 of the 7 swing states, losing Arizona. This occurs in 3.8% of simulations.
Fourth Most Likely: Harris wins 292 electoral votes
The fourth most likely outcome sees Harris winning the electoral college with 292 votes. In this scenario she wins the “blue wall” states, along with Nevada and either Georgia or North Carolina. Combined, these two different maps happen about 5% of the time and produce the same count of electoral votes.
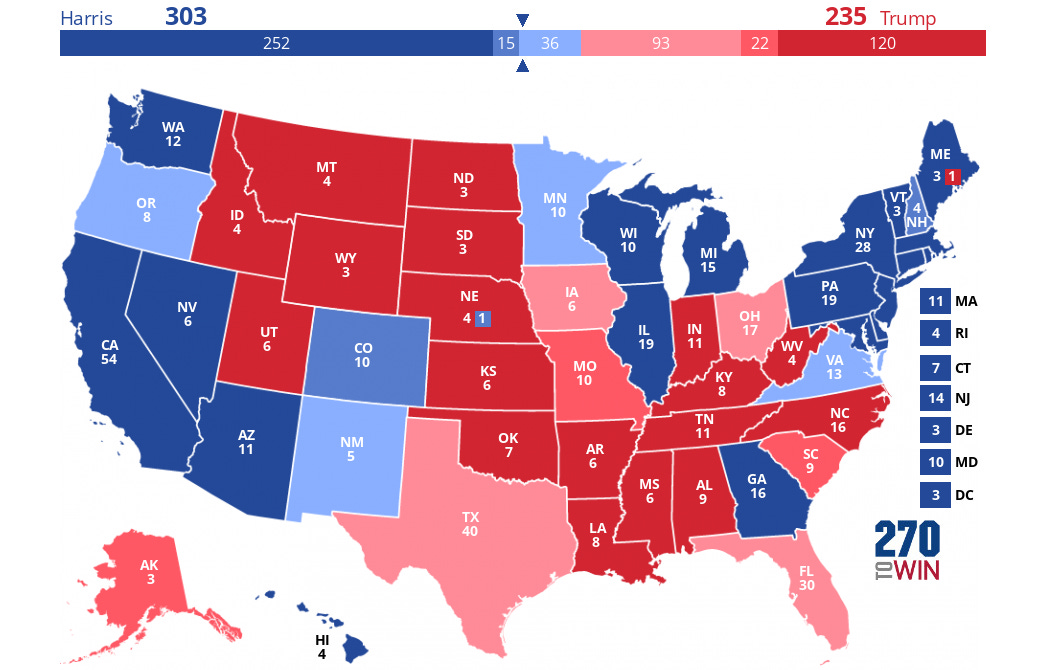
Fifth Most Likely: Harris wins 303 electoral votes
Lastly, the fifth most likely outcome sees Harris winning 303 electoral votes. This scenario sees Harris winning the blue wall states, winning Nevada, Arizona, and then either North Carolina or Georgia. Like the previous scenario, the split between it being North Carolina or Georgia is about even. Combined, this scenario happens 4.8% of the time.
All of these different scenarios make a lot of sense. Harris currently leads in my polling average by about 3.4%, every swing state is within 2% of one another, and no candidate has a vote share of over 49% in any of the battleground states as it currently stands. The model assumes a pretty high degree of correlation between the blue wall states, and a decently high (although not as much) between the sun belt states. If Trump’s vote share is underestimated in the polling average, he will hold the sun belt states and likely win all of the blue wall states. Likewise, if Harris’s vote share is underestimated she will easily carry the blue wall states and become very competitive in all 4 sun belt states.


